Top Bar Information
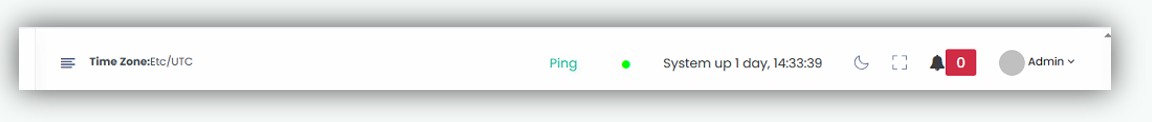
The Top Navigation Bar provides quick access to system Time Zone, service health indicators, diagnostic tools, and user interface controls. It enables administrators to view real time system status, perform basic diagnostics, and access user level options efficiently. The top navigation bar includes:
-
Time Zone
-
Ping diagnostic tool.
-
Core service status indicator
-
Probe status
-
System Uptime indicator
-
Light/Dark mode toggle
-
Full screen view control
-
System notifications
-
Administrator profile menu
-
Time Zone Displays the currently configured system time zone. Example: Etc/UTC
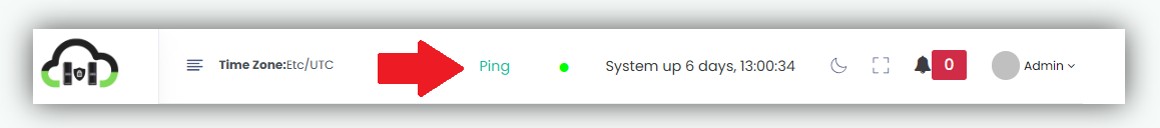
- Ping diagnostic tool.
- The Ping Diagnostic Tool is a built in utility that allows administrators to perform basic network connectivity checks directly from the Top Navigation Bar
Using the Ping Diagnostic Tool
- Click the Ping option from the Top Navigation Bar.
- A pop up dialog titled Ping IP/Domain is displayed
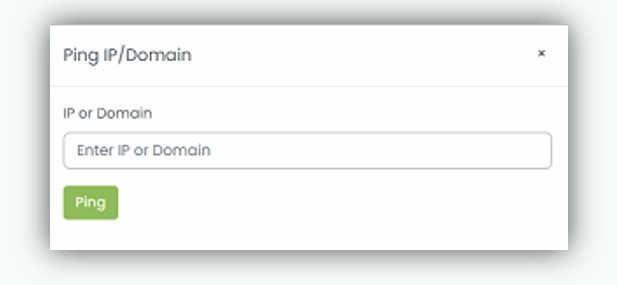
- In the IP or Domain field, enter a valid IP address or domain name. Example: 8.8.8.8, google.com
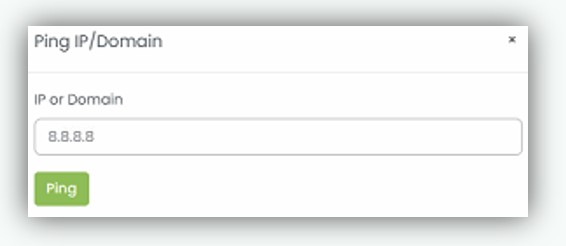
- Click Ping to initiate the connectivity check.
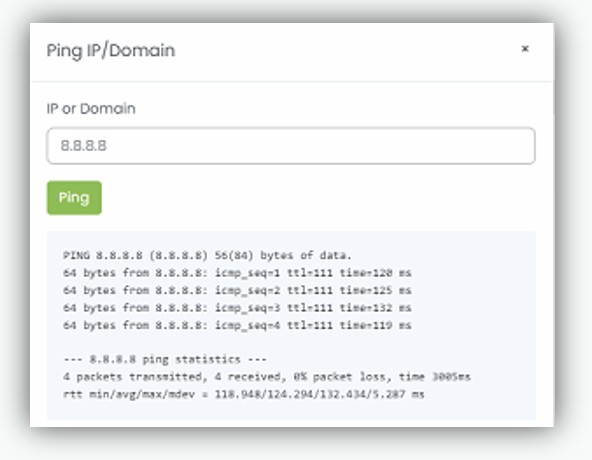
Result
- A successful response indicates that the target IP or domain is reachable.
- Failure to receive a response may indicate network connectivity issues, routing problems, or that the target host is unreachable.
Core service status indicator
Service Status Indicator provides a quick visual indication of core system service health.
- 🟢 Green indicator confirms that the system service is active.
- 🔴 Red indicator indicates that one or more core system services are not running or are in a failed state and require attention.
Probe status
The Probe Status becomes visible only when the Core Service Status indicator is in a failed 🔴 state. It provides additional diagnostic information to help administrators identify configuration or service level issues.
Behavior
- When all core services are operating normally, the Probe Status is not displayed.
- If the Core Service Status indicator turns red, the Probe option becomes visible in the Top Navigation Bar
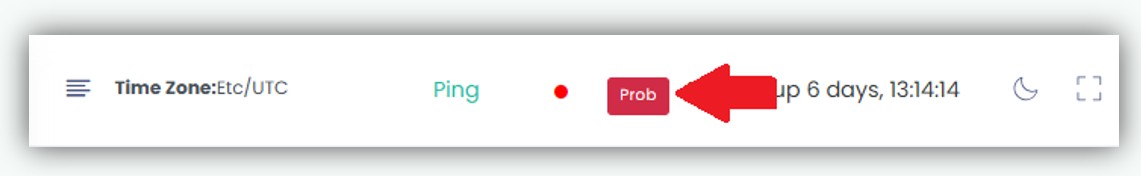
- Clicking Probe opens a diagnostic pop up displaying detailed error or configuration errors.
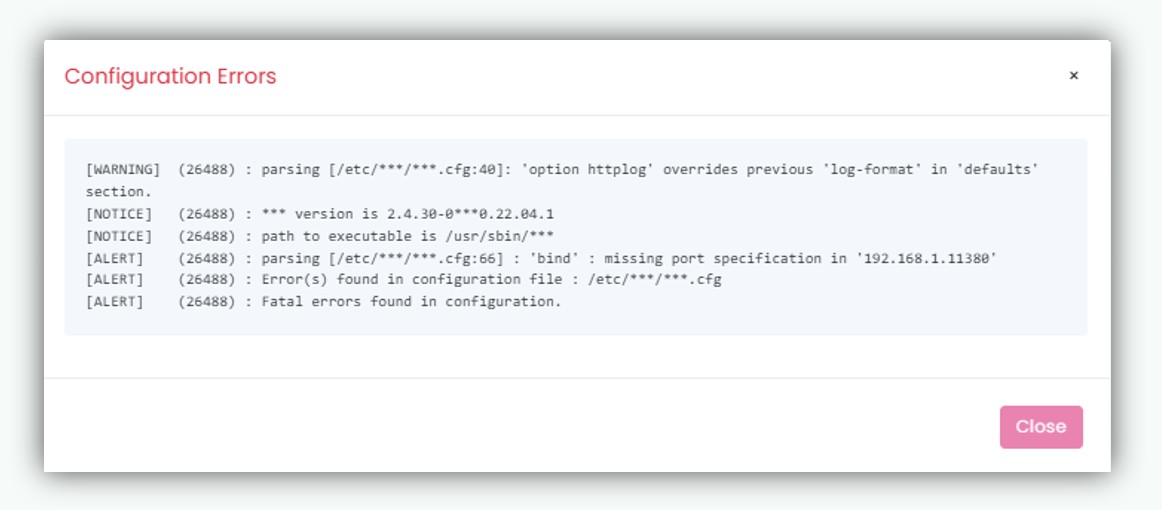
Probe Diagnostic Pop up
The Probe pop up displays detected configuration or service errors reported by internal health probes. Typical information may include:
- Invalid license or expired.
- Configuration parsing errors
- Missing or invalid parameters
- Service startup failures
System Uptime Indicator
Displays the total duration for which the system has been running since the last restart.
- Helps administrators verify system stability and recent restarts.
- Displayed on the right side of the top navigation bar.
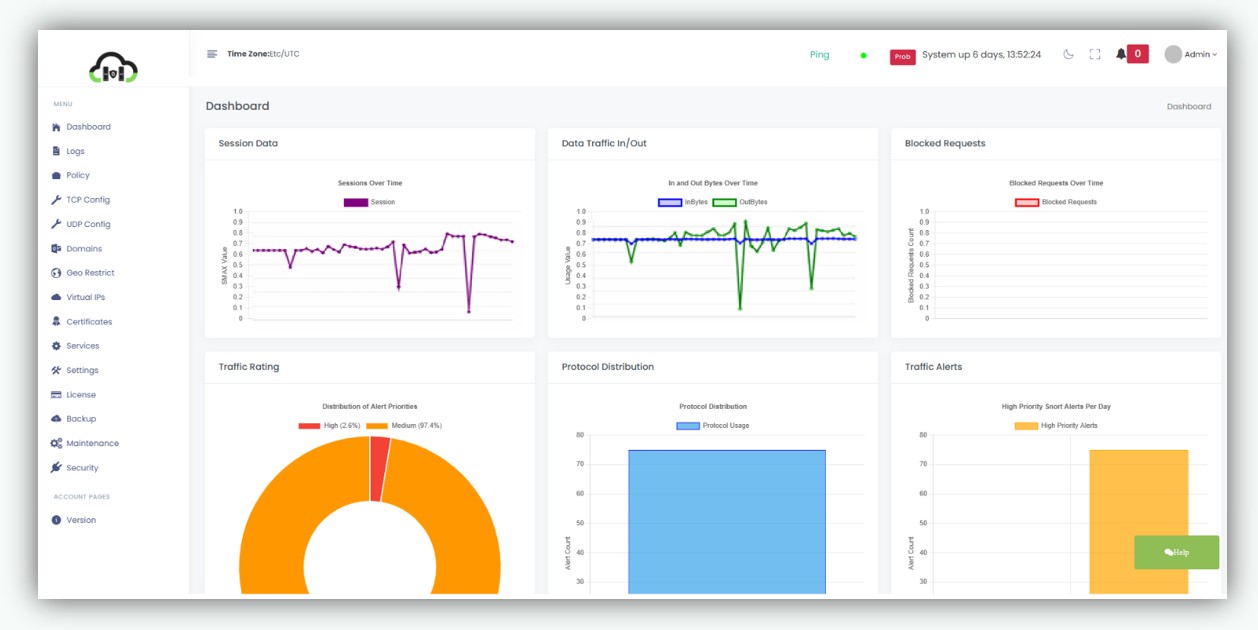
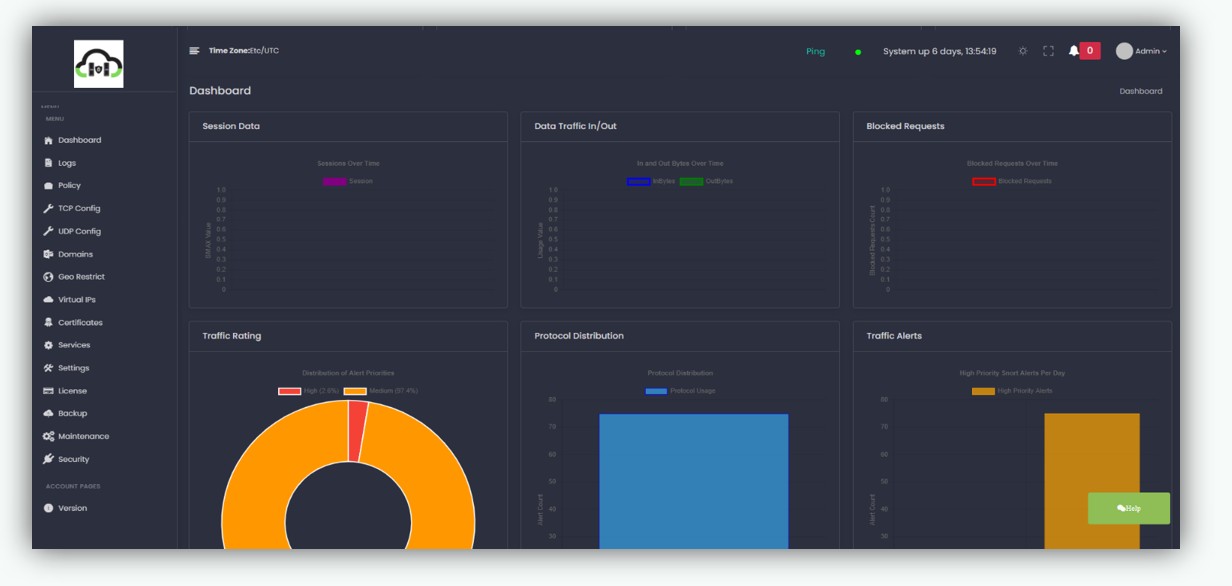
Light/Dark mode toggle
Allows users to switch between Light Mode and Dark Mode based on visibility preference and working environment.
Light Mode
Dark Mode
- Full-Screen view control
Clicking the Full Screen icon enables full screen view, providing a larger workspace for improved focus and usability.
-
System Notifications Displays system alerts and informational messages.
-
Shows the number of unread notifications.
-
Provides quick visibility into important system events.
-
Admin Profile menu Clicking Admin opens a drop down menu with user specific options:
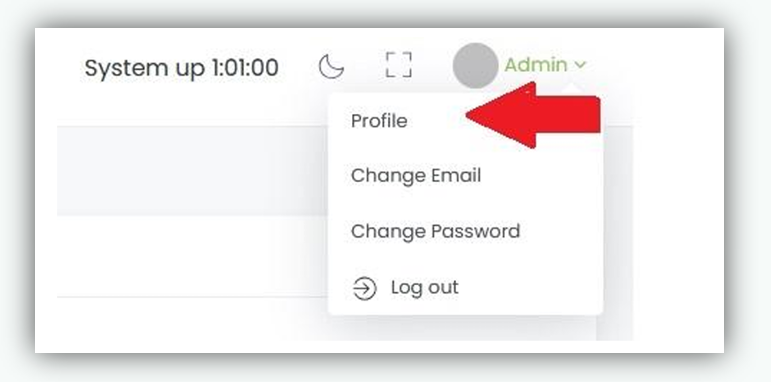
- Profile
- Change Email
- Change Password
- Logout
Profile
Opens the profile management page, where users can: o Update profile details o Enable Multi Factor Authentication (MFA) o Disable Multi Factor Authentication (MFA)